The table shows, for the years 1997-2012, the mean hourly wage for residents of the town of Pity Me and the mean weekly rent paid by the residents. 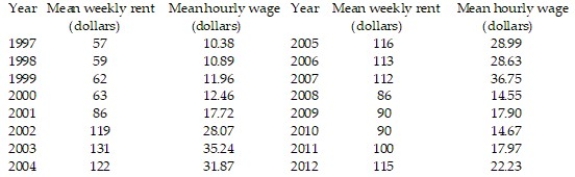 Summary statistics yield:
  = 1222.2771,
  = 3031.7125,
  = 9144.9375,
  = 21.2675, and
  Find the least squares line that uses mean hourly wage to predict mean weekly rent. Round values to the nearest ten-thousandth.
Correct Answer:
Verified
Q26: The data below are the average one-way
Q27: The data below are the average one-way
Q28: The data below are the number of
Q29: A manager wishes to determine the relationship
Q30: A manager wishes to determine the relationship
Q32: A county real estate appraiser wants to
Q33: A county real estate appraiser wants to
Q34: Is there a relationship between the raises
Q35: Is there a relationship between the raises
Q36: A large national bank charges local companies
Unlock this Answer For Free Now!
View this answer and more for free by performing one of the following actions

Scan the QR code to install the App and get 2 free unlocks

Unlock quizzes for free by uploading documents