Determine whether the graph can represent a normal curve. If it cannot, explain why.
-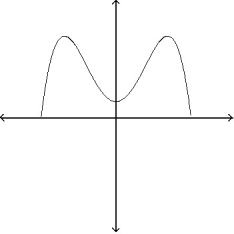
A) The graph cannot represent a normal density function because a normal density curve should approach but not reach the horizontal axis as x increases and decreases without bound.
B) The graph cannot represent a normal density function because it is bimodal.
C) The graph can represent a normal density function.
D) A and B are both true.
Correct Answer:
Verified
Q5: You are performing a study about the
Q6: The graph of a normal curve is
Q7: Determine whether the graph can represent a
Q8: Determine whether the graph can represent a
Q9: Determine whether the graph can represent a
Q11: The analytic scores on a standardized aptitude
Q12: Find the sum of the areas under
Q13: Determine the area under the standard normal
Q14: Determine the area under the standard normal
Q15: Determine the area under the standard normal
Unlock this Answer For Free Now!
View this answer and more for free by performing one of the following actions

Scan the QR code to install the App and get 2 free unlocks

Unlock quizzes for free by uploading documents