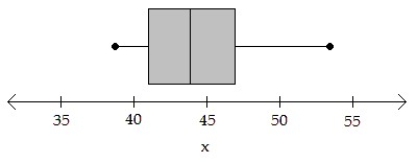
A simple random sample of size n < 30 for a quantitative variable has been obtained. Using the normal probability plot, the correlation between the variable and expected z-score, and the boxplot, judge whether a t-interval should be constructed.
-n = 10; Correlation = 0.896 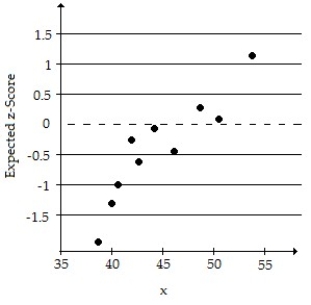
Correct Answer:
Verified
Q6: A confidence interval for p can be
Q7: A local outdoor equipment store is being
Q8: When choosing the sample size for estimating
Q9: Determine the point estimate of the population
Q10: A simple random sample of size n
Q12: Suppose a 99% confidence interval for ?
Q13: A computer package was used to generate
Q14: Find the t-value. Q15: Find the t-value. Q16: Find the t-value.
-Let ![]()
-Find the t-value such that
-Find the t-value such that
Unlock this Answer For Free Now!
View this answer and more for free by performing one of the following actions

Scan the QR code to install the App and get 2 free unlocks

Unlock quizzes for free by uploading documents