Suppose that the table shows the world carbon dioxide emissions y in millions of metric tons during the years 1999 to 2004. Find the least squares regression line for the data. Let t represent the year, with  corresponding to 1999. Round your answer to four significant figures
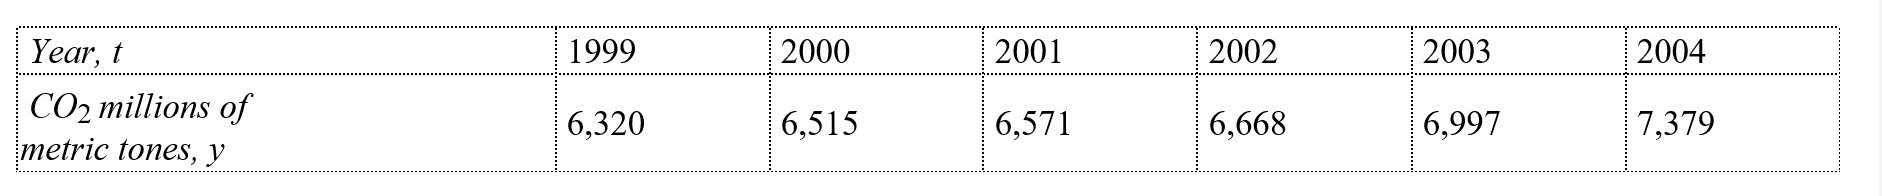
A) 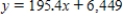
B) 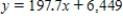
C) 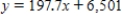
D) 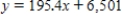
E) 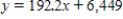
Correct Answer:
Verified
Q35: Find the least squares solution of the
Q36: Graph the points Q37: Find the least squares regression line for Q38: Suppose that the following table shows the Q39: Suppose that the following table shows the Q41: Find the cross product Q42: Sketch the graph of the cross product Q43: Find the cross product Q44: Show that the cross product Q45: Find the cross product Unlock this Answer For Free Now! View this answer and more for free by performing one of the following actions Scan the QR code to install the App and get 2 free unlocks Unlock quizzes for free by uploading documents![]()
![]()
![]()

![]()

