Multiple Choice
Figure 10-7
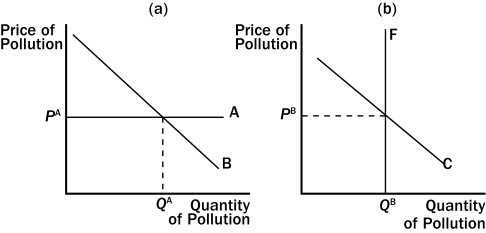
-Refer to Figure 10-7.Which graph illustrates a corrective tax?
A) the left graph
B) the right graph
C) both graphs
D) neither graph
Correct Answer:
Verified
Related Questions
Q121: Which of the following statements is not
Q166: Which of the following statements is correct?
A)Corrective
Q183: The difference between a corrective tax and
Q188: With pollution permits, the supply curve for
Q188: Which of the following is not a
Q193: What is the difference between command-and-control policies
Unlock this Answer For Free Now!
View this answer and more for free by performing one of the following actions

Scan the QR code to install the App and get 2 free unlocks

Unlock quizzes for free by uploading documents