Multiple Choice
Figure 5-8. A demand curve is shown on the graph below. On the graph, Q represents quantity demanded and P represents price.
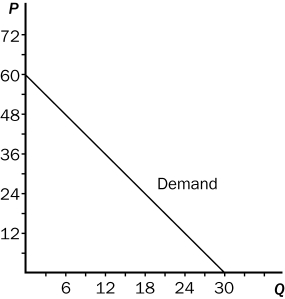
-Refer to Figure 5-8.At a price of $48 per unit,sellers' total revenue amounts to
A) $150.
B) $200.
C) $288.
D) $364.
Correct Answer:
Verified
Related Questions

