Multiple Choice
Figure 5-8. A demand curve is shown on the graph below. On the graph, Q represents quantity demanded and P represents price.
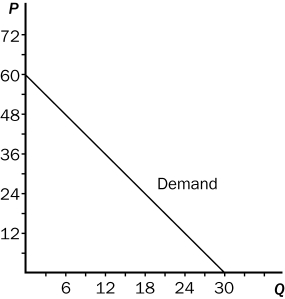
-Refer to Figure 5-8.Using the midpoint method,between prices of $48 and $54,price elasticity of demand is about
A) 0.92.
B) 3.89.
C) 4.33.
D) 5.67.
Correct Answer:
Verified
Related Questions

