Figure 5-7
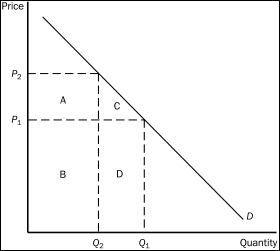
-Refer to Figure 5-7.Total revenue when the price is P₁ is represented by the area(s)
A) B + D.
B) A + B.
C) C + D.
D) D.
Correct Answer:
Verified
Q103: Figure 5-6 Q105: Figure 5-8. A demand curve is shown Q107: Figure 5-8. A demand curve is shown Q110: Figure 5-8. A demand curve is shown Q113: Figure 5-8. A demand curve is shown Q160: When demand is inelastic,the price elasticity of Q163: If the demand for donuts is elastic,then Q169: If the price elasticity of demand for Q189: If the price elasticity of demand for Q279: An increase in price causes an increase
![]()
Unlock this Answer For Free Now!
View this answer and more for free by performing one of the following actions

Scan the QR code to install the App and get 2 free unlocks

Unlock quizzes for free by uploading documents