Figure 5-1
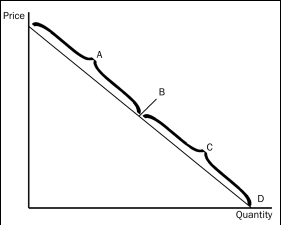
-Refer to Figure 5-1.Assume the section of the demand curve labeled A corresponds to prices between $8 and $16.Then,when the price changes between $9 and $10,
A) quantity demanded changes proportionately less than the price.
B) quantity demanded changes proportionately more than the price.
C) quantity demanded changes the same amount proportionately as price.
D) the price elasticity of demand is less than 1.
Correct Answer:
Verified
Q32: The price elasticity of demand for bread
A)is
Q44: Figure 5-1 Q47: Figure 5-2 Q51: Figure 5-1 Q52: Figure 5-2 Q53: Figure 5-1 Q54: The midpoint method for calculating elasticities is Unlock this Answer For Free Now! View this answer and more for free by performing one of the following actions Scan the QR code to install the App and get 2 free unlocks Unlock quizzes for free by uploading documents
![]()
![]()
![]()
![]()
![]()

