Multiple Choice
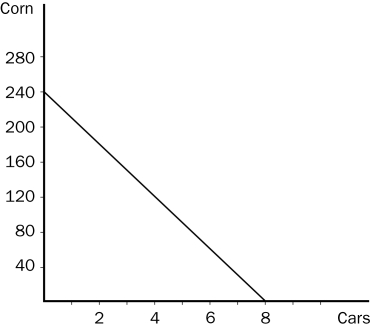
Figure 3-5 The graph below represents the various combinations of cars and corn that Country A could produce in a given month. (On the vertical axis, corn is measured in bushels.)

-Refer to Figure 3-5.Which of the following combinations of cars and corn could Country A produce in a given month?
A) 7 cars and 40 bushels of corn
B) 5 cars and 92 bushels of corn
C) 3 cars and 165 bushels of corn
D) 2 cars and 180 bushels of corn
Correct Answer:
Verified
Related Questions
Q146: A good that is produced abroad and
Q147: Table 3-5 Q148: Figure 3-5 The graph below represents the Q149: Figure 3-5 The graph below represents the
![]()

