The graphs here show the number of undecayed nuclei as a function of time for a radioactive element. The graph corresponding to elements having the smaller decay constant is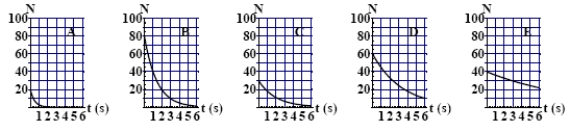
A) A
B) B
C) C
D) D
E) E
Correct Answer:
Verified
Q36: The radioactivity of a certain radioisotope decreases
Q37: If 30 g of substance remain from
Q38: A certain radioisotope has a lifetime of
Q39: If 40 g of substance of half-life
Q40: After 4.5 days, 50 g of substance
Q41: At a particular time, a radioactive source
Q42: The graph here shows the number of
Q43: The graph here shows the number of
Q44: The graphs here show the number of
Q46: The radioactivity due to 14C (half-life 5730
Unlock this Answer For Free Now!
View this answer and more for free by performing one of the following actions

Scan the QR code to install the App and get 2 free unlocks

Unlock quizzes for free by uploading documents