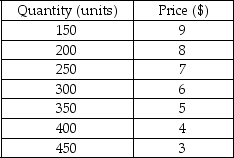
The following table shows the quantities of a good sold by a monopolist at different prices.

-Refer to the table above.Which of the following statements is true of the monopolist's total revenue?
A) As the monopolist reduces the price of its product from $9 to $3, its total revenue decreases.
B) As the monopolist reduces the price of its product from $9 to $3, its total revenue increases.
C) As the monopolist reduces the price of its product from $9 to $3, its total revenue increases and then decreases.
D) As the monopolist reduces the price of its product from $9 to $3, its total revenue decreases and then increases.
Correct Answer:
Verified
Q93: Scenario: Mr. Olivander has a monopoly on
Q94: Scenario: When a monopolist charges $5 for
Q95: The figure below shows the demand curve
Q96: The following table shows the quantities of
Q97: The quantity effect of a price reduction
Q99: For a firm with market power,the price
Q100: The figure below shows the demand curve
Q101: The following figure shows the demand curve
Q102: Which of the following characterizes the relation
Q103: The following figure shows the demand curve
Unlock this Answer For Free Now!
View this answer and more for free by performing one of the following actions

Scan the QR code to install the App and get 2 free unlocks

Unlock quizzes for free by uploading documents