The following figure shows the marginal cost curve and the average total cost curve of a firm operating in a perfectly competitive market.
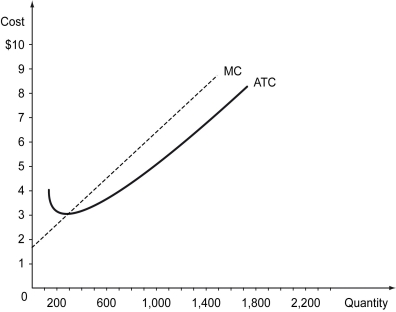
-Refer to the figure above.Suppose the price in this market is $5.What is the revenue of the firm,when it sells the profit-maximizing level of output?
A) $5,000
B) $1,600
C) $1,800
D) $3,500
Correct Answer:
Verified
Q92: Scenario: A small firm manufactures maple baseball
Q93: Scenario: The scenario above changes, because an
Q94: The following figure shows the marginal cost
Q95: The following figure shows the marginal cost
Q96: If price is greater than the average
Q98: The following figure shows the marginal cost
Q99: The following figure shows the marginal cost
Q100: When two firms in a perfectly competitive
Q101: Scenario: A manufacturing firm operates three plants
Q102: The following figure depicts the short-run cost
Unlock this Answer For Free Now!
View this answer and more for free by performing one of the following actions

Scan the QR code to install the App and get 2 free unlocks

Unlock quizzes for free by uploading documents