The demand curves for good A and B are depicted in the following graph.We can conclude that ________.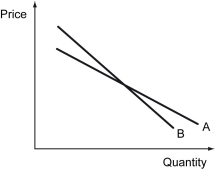
A) the price elasticity of demand for good A is smaller than good B
B) the price elasticity of demand for good A is larger than good B
C) good A is perfectly elastic
D) good A is perfectly inelastic.
Correct Answer:
Verified
Q96: The percentage change in the quantity demanded
Q97: The following figure illustrates the market demand
Q98: The following table shows the benefit that
Q99: The following figure shows the market demand
Q100: The weekly quantity demanded of frozen pizzas
Q102: The following figure illustrates the market demand
Q103: Sofia is selling homemade cakes.The demand for
Q104: Scenario: When the price of wine is
Q105: The following figure illustrates the market demand
Q106: Which of the following formulas is used
Unlock this Answer For Free Now!
View this answer and more for free by performing one of the following actions

Scan the QR code to install the App and get 2 free unlocks

Unlock quizzes for free by uploading documents