The following figure shows the market demand curve for calculators.
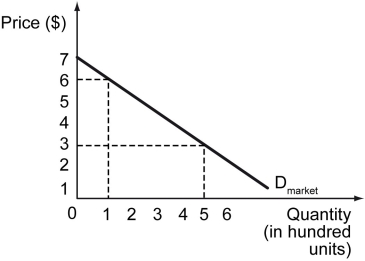
-Refer to the figure above.What is the gain in the market-wide consumer surplus when the price of calculators changes from $6 per unit to $3 per unit?
A) $565
B) $580
C) $950
D) $1,050
Correct Answer:
Verified
Q88: Which of the following statements correctly differentiates
Q89: a)Define the term "consumer surplus." If your
Q90: Which of the following is the best
Q91: Elasticity is _.
A) the sum of the
Q92: The following figure shows the market demand
Q94: The following table shows the marginal benefit
Q95: If the price of a good increases,_.
A)
Q96: The percentage change in the quantity demanded
Q97: The following figure illustrates the market demand
Q98: The following table shows the benefit that
Unlock this Answer For Free Now!
View this answer and more for free by performing one of the following actions

Scan the QR code to install the App and get 2 free unlocks

Unlock quizzes for free by uploading documents