The graph below shows the normal concentration of morphogens A and B throughout a Drosophila embryo. 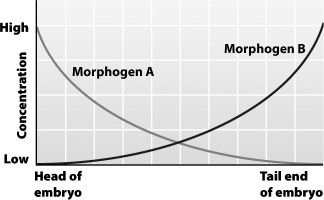
If morphogen B is injected into the head end of an embryo, the embryo is likely to develop
A) normally.
B) a second tail at the head end.
C) a second head at the tail end.
D) two heads at the head end.
Correct Answer:
Verified
Q55: Which of the following does not affect
Q56: Spermatogenesis results in the production of _
Q57: To start a stem cell line from
Q58: In oogenesis, the final steps of meiosis
Q59: Genes are generally switched on or off
Q61: Latex condoms prevent the spread of all
Q63: The four sperm produced by spermatogenesis is
Q65: Hermaphrodites are able to fertilize their own
Q67: In the last few weeks of pregnancy,oxytocin
Q68: The mitochondria in your cells are a
Unlock this Answer For Free Now!
View this answer and more for free by performing one of the following actions

Scan the QR code to install the App and get 2 free unlocks

Unlock quizzes for free by uploading documents