Examine the graph below. 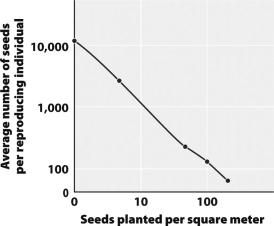
What statement best describes the relationship between planting density and seed production per individual plant?
A) At high planting densities, both seed production per plant and total seeds produced declines.
B) At high planting densities, seed production per plant declines while total seeds produced remains constant.
C) At low planting densities, both seed production per plant and total seeds produced increases.
D) At high planting densities, seed production per plant declines while total seeds produced increases.
Correct Answer:
Verified
Q14: A population will remain at a constant
Q21: The figure below shows that the human
Q23: The graph below shows the growth of
Q23: For most populations,irregular fluctuations in size or
Q24: Studies of the population-size cycles seen between
Q27: Which of the following situations illustrates a
Q28: The top of the "S"in an S-shaped
Q30: The carrying capacity of owls in an
Q30: In computing an individual's ecological footprint, which
Q31: The amount of productive land and water
Unlock this Answer For Free Now!
View this answer and more for free by performing one of the following actions

Scan the QR code to install the App and get 2 free unlocks

Unlock quizzes for free by uploading documents