According to the figure below, the r allele is less frequent in generation II of this flower population. The frequency of r decreases in this population because 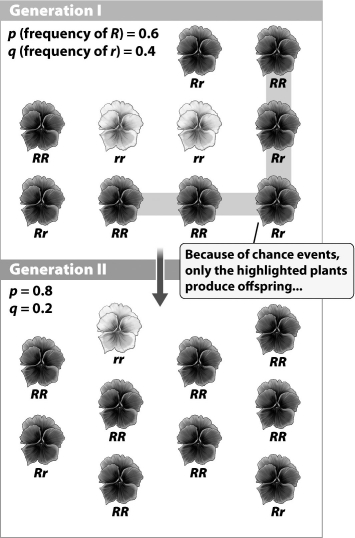
A) of genetic drift.
B) recessive alleles are always less common than dominant alleles.
C) p + q must always equal 1.
D) R alleles are more likely to "hide" r alleles in generation II.
Correct Answer:
Verified
Q22: A fisherman catches one trout from each
Q23: What is genetic drift?
A)gene mutation within, or
Q24: While on a camping trip, you collect
Q25: Which of the following is a valid
Q26: In your backyard, you step on a
Q28: Several related bird species live in a
Q29: In the figure below, the flying bird
Q30: A population of 8,250 mice occupies the
Q31: Is the effect of an individual permanently
Q32: Gene flow occurs
A)as a result of genetic
Unlock this Answer For Free Now!
View this answer and more for free by performing one of the following actions

Scan the QR code to install the App and get 2 free unlocks

Unlock quizzes for free by uploading documents