The scatter diagram represents a data set and a plot of the simple linear regression equation estimated from the data. The diagram shows evidence of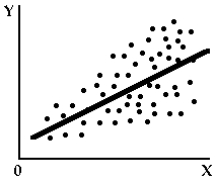
A) homoscedasticity.
B) heteroscedasticity.
C) positive autocorrelation.
D) negative autocorrelation.
Correct Answer:
Verified
Q14: The application of multiple regression analysis to
Q15: The application of multiple regression analysis to
Q16: The application of multiple regression analysis to
Q17: The application of multiple regression analysis to
Q18: Autocorrelation can be the result of
A) the
Q20: The scatter diagram represents the error terms
Q21: The identification problem refers to the difficulties
Q22: The estimation of consumer demand by questioning
Q23: The estimation of consumer demand by setting
Q24: The estimation of consumer demand by monitoring
Unlock this Answer For Free Now!
View this answer and more for free by performing one of the following actions

Scan the QR code to install the App and get 2 free unlocks

Unlock quizzes for free by uploading documents