Figure 1.1 U.S. Production Possibilities Curve
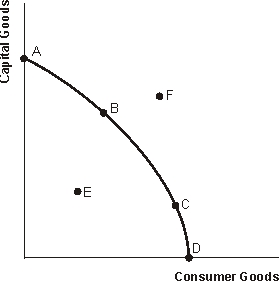
-Refer to Figure 1.1. The shape of the production possibilities curve suggests that the United States produces under conditions of
A) zero opportunity cost
B) constant opportunity cost
C) increasing opportunity cost
D) decreasing opportunity cost
Correct Answer:
Verified
Q53: The bowed-out shape of a production possibilities
Q54: Capacity utilization rates in the U.S.
A) are
Q55: The opportunity cost of taking a trip
Q56: A rational person does not act unless
Q57: Assuming that rational people are motivated by
Q59: Figure 1.1 U.S. Production Possibilities Curve
Q60: Figure 1.1 U.S. Production Possibilities Curve
Q61: Figure 1.1 U.S. Production Possibilities Curve
Q62: Figure 1.1 U.S. Production Possibilities Curve
Q63: Table 1.1. U.S. Production Possibilities Curve
Unlock this Answer For Free Now!
View this answer and more for free by performing one of the following actions

Scan the QR code to install the App and get 2 free unlocks

Unlock quizzes for free by uploading documents