Figure 4B
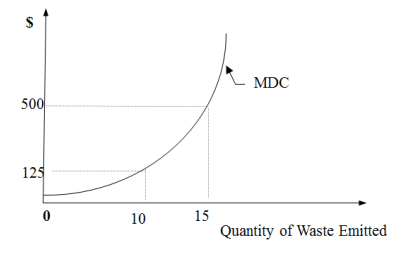
-Refer to Figure 4B. Which of the following is an incorrect description of the marginal pollution-damage cost curve?
A) Is an increasing function of pollution emissions
B) Shows that the damage caused by a unit of pollution increases progressively as the
amount of pollution emitted increases
C) The marginal damage cost increases from $125 to $500 as the amount of waste emissions
increases from 10 to 15 units
D) The marginal damage cost decreases from $125 to $500 as the amount of waste emissions
increases from 10 to 15 units
E) All of the above are incorrect
Correct Answer:
Verified
Q15: The optimal level of pollution is attained
Q16: From an economic viewpoint, expenditure on pollution
Q17: Examples of pollution control costs include:
A) Sequestering
Q18: The marginal pollution control cost
A) Remains constant

