Figure 3A
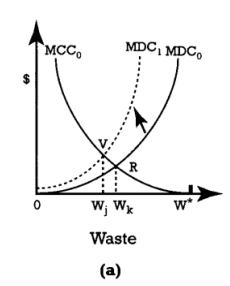
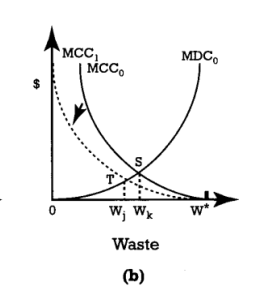
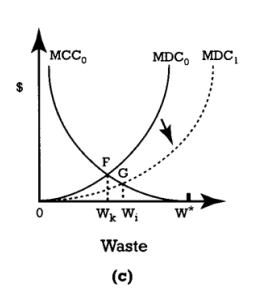
-Refer to Figure 3A. Assume that one starts at any point that indicates an optimal pollution level. Further assume that there is an educational campaign of awareness that results in a
change in social preference such that environmental quality is believed to be of utmost
importance - increasing its demand. Which panel or panels would indicate a movement in
the curves reflecting this social preference change?
A) Panel (a) only
B) Panel (b) only
C) Panel (c) only
D) Panels (a) and (c)
E) Panel (a) and (b)
Correct Answer:
Verified
Q15: The Coase theorem states that an optimal
Q16: Which one of the following is the
Q17: The marginal social cost curve is obtained
Q18: Which one of the following is most
Q19: Assume that the local museum in your
Q20: Which one of the following statements about
Q21: Which of the following statements about the
Q22: Which one of the following is not
Q23: Figure 3A Q25: Which of the following is true in
![]()
Unlock this Answer For Free Now!
View this answer and more for free by performing one of the following actions

Scan the QR code to install the App and get 2 free unlocks

Unlock quizzes for free by uploading documents