(Figure: Sugar Market) Refer to the graph which shows a quota of 34 million pounds of sugar in the sugar market. Using the graph answer the following questions:
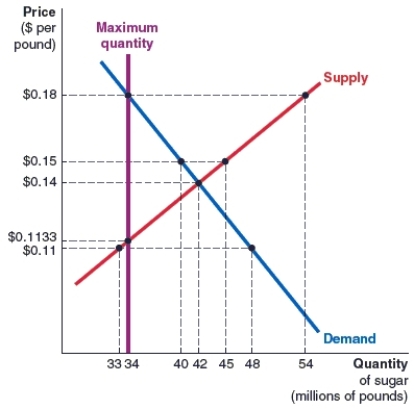 (a) The quota lowers the quantity of sugar purchased in the market by _____ million pounds.
(b) What is the price that each buyer is willing to pay for a pound of sugar after the quota has been placed on the market?
(c) What is the price that each seller is willing to accept for a pound of sugar after the quota has been placed on the market?
Correct Answer:
Verified
Q104: (Figure: Market for Plastic Containers) The figure
Q105: This question has two parts:
(a) What is
Q106: (Figure: Tax on Seller) Refer to the
Q107: (Figure: Tax on Buyer) Refer to the
Q108: Fill in the blanks below using one
Q110: The table shows the market for
Q111: The table shows market data for
Q112: (Figure: Quota) Refer to the graph which
Q113: (Figure: Market for Logs) Suppose that the
Q114: (Figure: Price Ceiling) Refer to the graph.
Unlock this Answer For Free Now!
View this answer and more for free by performing one of the following actions

Scan the QR code to install the App and get 2 free unlocks

Unlock quizzes for free by uploading documents