Which of the graphs shows the correct shape of the labor market Phillips curve?
A) 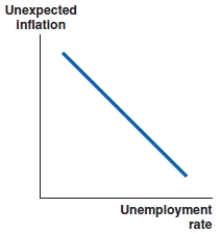
B) 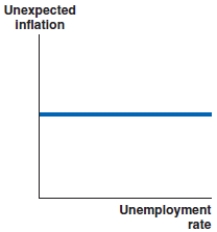
C) 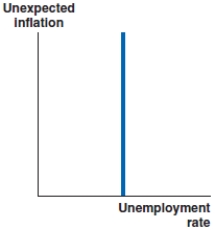
D) 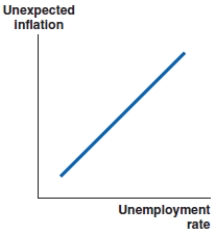
Correct Answer:
Verified
Q62: Using the Phillips curve to forecast future
Q63: High unemployment occurs when:
A)there is insufficient demand.
B)inflation
Q64: High unemployment occurs when:
A)there is excess demand.
B)inflation
Q65: Unemployment will rise when:
A)there is excess demand.
B)inflation
Q66: Which of these choices is correct? Holding
Q68: When unexpected inflation is zero, the corresponding
Q69: When unexpected inflation is zero, the corresponding
Q70: When unexpected inflation is zero, the corresponding
Q71: When the economy is at potential GDP,
Q72: Suppose that the euro depreciates. Which figure
Unlock this Answer For Free Now!
View this answer and more for free by performing one of the following actions

Scan the QR code to install the App and get 2 free unlocks

Unlock quizzes for free by uploading documents