(Figure: Shift of the Aggregate Demand Curve) Use Figure: Shift of the Aggregate Demand Curve. An increase in aggregate demand is illustrated by a movement from:
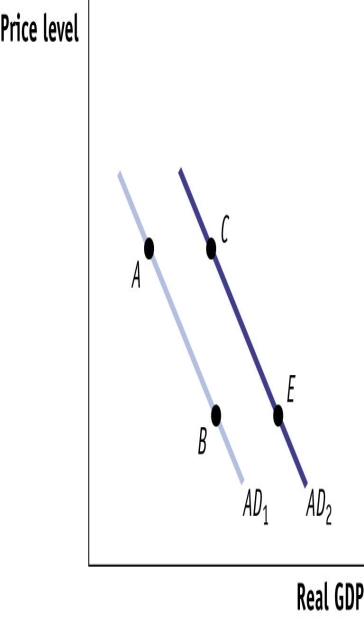
a. AD1 to AD2.
b. AD1 to AD2.
c. point C to point A.
d. point C to point A.
e. point B to point A.
f. point B to point A.
g. point C to point E.
h. point C to point E.
Correct Answer:
Verified
Q158: Suppose that consumer expectations improve. This will
Q159: The short-run aggregate supply curve is:
A)downward sloping.
B)downward
Q160: Assuming that prices remain constant, suppose that
Q161: During the Great Depression, the U.S. economy
Q162: (Figure: Shift of the Aggregate Demand Curve)
Q164: (Figure: Shift of the Aggregate Demand Curve)
Q165: (Figure: Shift of the Aggregate Demand Curve)
Q166: (Figure: Shift of the Aggregate Demand Curve)
Q167: (Figure: Shift of the Aggregate Demand Curve)
Q168: Suppose the economy is in a recession.
Unlock this Answer For Free Now!
View this answer and more for free by performing one of the following actions

Scan the QR code to install the App and get 2 free unlocks

Unlock quizzes for free by uploading documents