The shaded region of the figure below represents: 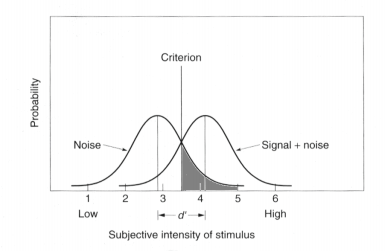
A) the proportion of correct rejections
B) the proportion of false alarms
C) the proportion of hits
D) the proportion of misses
Correct Answer:
Verified
Q20: Kyle performs a detection task in which
Q21: In Signal Detection Theory, d' represents:
A) the
Q22: After Peter participates in a detection task,
Q23: After Paul participates in a detection task,
Q24: The shaded region of the figure below
Q26: Frank, Gerald, Helen, and Jacob participate in
Q27: The distributions below show the results from
Q28: The distributions below show the results from
Q29: The distributions below show the results from
Q30: The distributions below show the results from
Unlock this Answer For Free Now!
View this answer and more for free by performing one of the following actions

Scan the QR code to install the App and get 2 free unlocks

Unlock quizzes for free by uploading documents