Figure 1 illustrates an election in which there are seven voters (A, B, C, D, E, F, G) arrayed along a single left-right issue dimension that runs from 0 (most left) to 10 (most right) . Each voter is assumed to have a single-peaked preference ordering over the issue dimension and to vote for the party that is located closest to her ideal point. The voters are participating in a majority rule election in which there are two parties, P1 and P2, competing for office. These parties can be thought of as "office-seeking" parties since they only care about winning the election and getting into office.
Figure 1: Illustrating the Median Voter Theorem
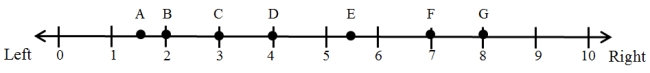
-What is the ideological position of the median voter in Figure 1?
A) 1.5
B) 2
C) 3
D) 4
E) 5
F) 5.5
G) 7
H) 8
Correct Answer:
Verified
Q12: If a voter chooses an alternative that
Q13: Consider the following preference orderings.
Councillor 1:
Q14: What's the difference between a preference ordering
Q15: Do voters need to have single-peaked preferences
Q16: According to the logic of the median
Q18: Figure 1 illustrates an election in which
Q19: Figure 1 illustrates an election in which
Q20: Suppose that some event occurs that causes
Q21: Suppose now that some polarizing event occurs
Q22: What happens if we extend the logic
Unlock this Answer For Free Now!
View this answer and more for free by performing one of the following actions

Scan the QR code to install the App and get 2 free unlocks

Unlock quizzes for free by uploading documents