Multiple Choice
Refer to the graph below.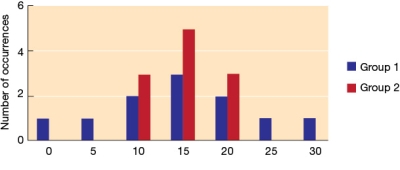 Scores for Group 1 differ most dramatically from scores for Group 2 in their
A) mean.
B) mode.
C) standard deviation.
D) median.
Correct Answer:
Verified
Related Questions
Q47: You accept a job selling high-end knives
Q48: Refer to the set of numbers below.
2,
Q49: Refer to the set of numbers below.
2,
Q50: The median is better than the mean
Unlock this Answer For Free Now!
View this answer and more for free by performing one of the following actions

Scan the QR code to install the App and get 2 free unlocks

Unlock quizzes for free by uploading documents