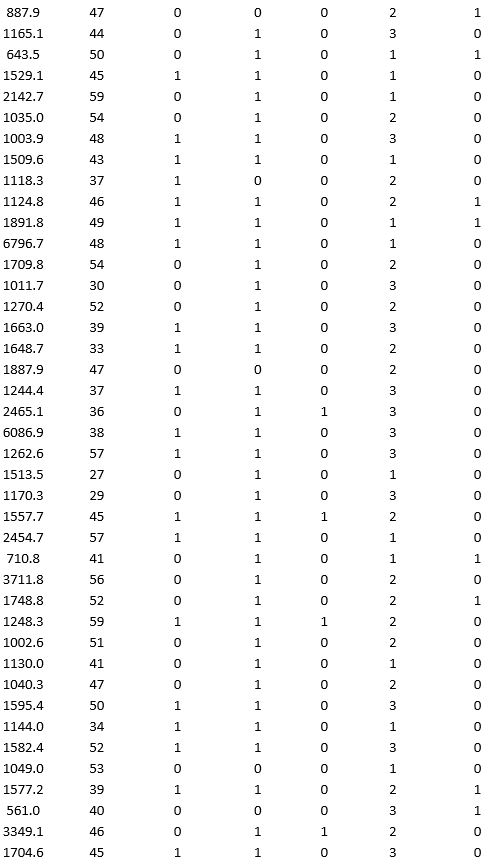
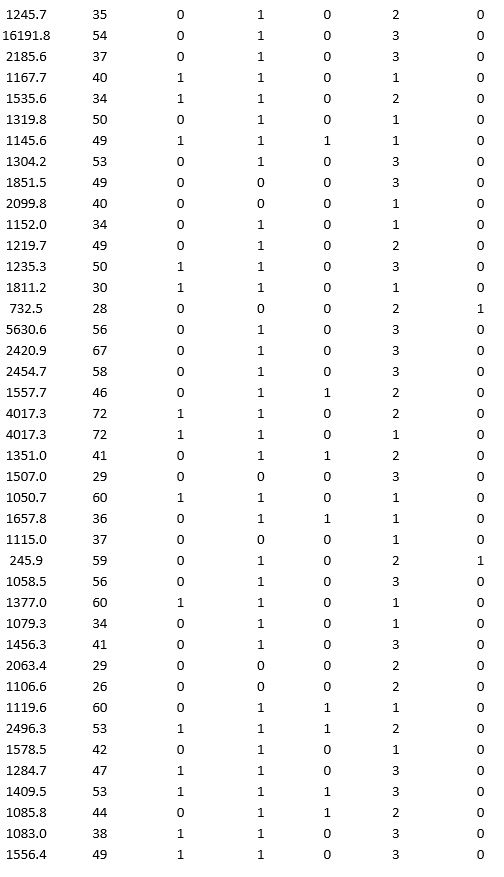
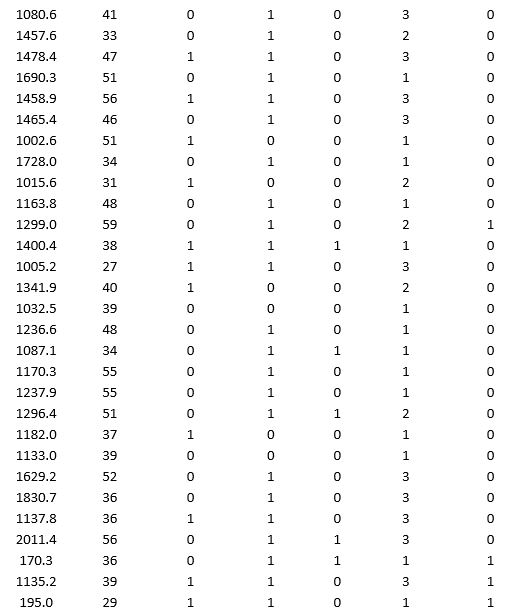
A bank wants to understand better the details of customers who are likely to default the loan. In order to analyze this, the data from a random sample of 200 customers are given below:

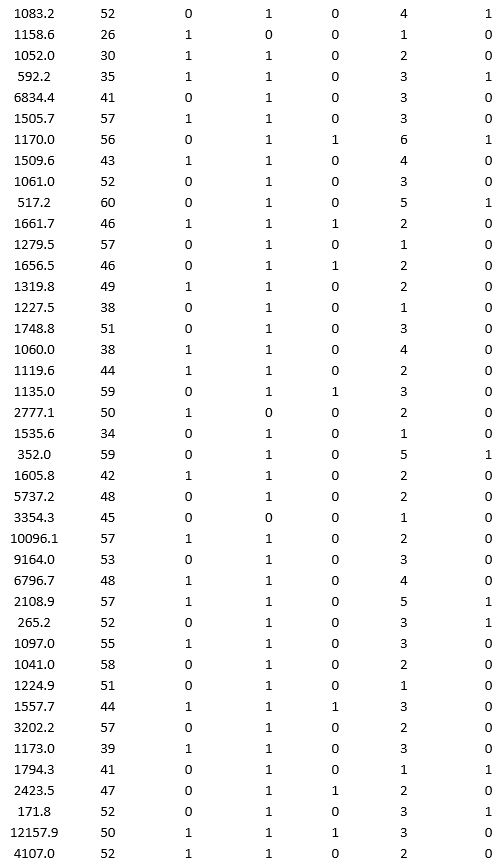
In XLMiner's Partition with Oversampling procedure, partition the data so there is 50 percent successes (Loan default) in the training set and 40 percent of the validation data are taken away as test data. Construct a logistic regression model using Loan default as the output variable and all the other variables as input variables. Perform an exhaustive-search best subset selection with the number of best subsets equal to 2. Generate lift charts for both the validation data and test data.
a. From the generated set of logistic regression models, select one that is a good fit. Express the model as a mathematical equation relating the output variable to the input variables. Do the relationships suggested by the model make sense? Try to explain them.
b. Using the default cutoff value of 0.5 for your logistic regression model, what is the overall error rate on the test data?
c. Examine the decile-wise lift chart for your model on the test data. What is the first decile lift? Interpret this value.
Correct Answer:
Verified
View Answer
Unlock this answer now
Get Access to more Verified Answers free of charge
Q25: In which of the following scenarios would
Q26: A _ classifies a categorical outcome variable
Q29: An observation classified as part of a
Q37: _ is a generalization of linear regression
Q38: _ is a measure of calculating dissimilarity
Q42: A retailer is interested in analyzing the
Q43: As part of the quarterly reviews, the
Q44: A bank is interested in identifying different
Q45: A bank wants to understand better the
Q46: A bank wants to understand better the
Unlock this Answer For Free Now!
View this answer and more for free by performing one of the following actions

Scan the QR code to install the App and get 2 free unlocks

Unlock quizzes for free by uploading documents