The following scatter chart would help conclude that: 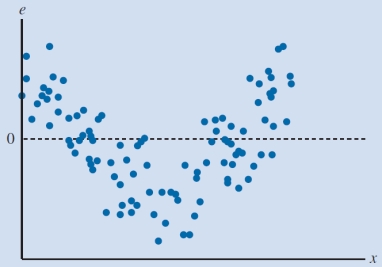
A) the residuals have a constant variance.
B) the model fails to capture the relationship between the variables accurately.
C) the model underpredicts the value of the dependent variable for intermediate values of the independent variable.
D) the residual is normally distributeD)
Correct Answer:
Verified
Q16: When the mean value of the dependent
Q20: A regression analysis involving one independent variable
Q21: What would be the mean square due
Q22: Which of the following inferences can be
Q25: The following scatter chart would help conclude
Q28: _ refers to the use of sample
Q29: What would be the mean square error
Q39: The _ is an indication of how
Q41: _ is the data set used to
Q44: _ refers to the data set used
Unlock this Answer For Free Now!
View this answer and more for free by performing one of the following actions

Scan the QR code to install the App and get 2 free unlocks

Unlock quizzes for free by uploading documents