The figure given below depicts the foreign exchange market for British pounds traded for U.S. dollars.?Figure 21.2
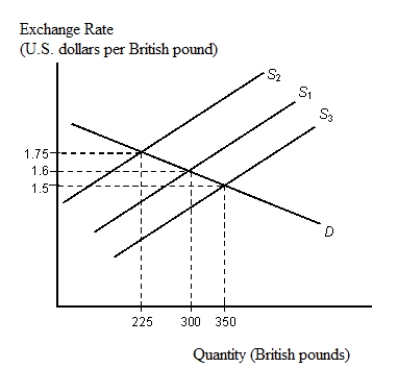
-Refer to Figure 21.2. At the initial equilibrium point, with demand curve D and supply curve S₁:
A) the price of dollar per British pound is $1.50 and the quantity of British pounds being traded is 225.
B) the price of dollar per British pound is $1.60 and the quantity of British pounds being traded is 225.
C) the price of dollar per British pound is $1.60 and the quantity of British pounds being traded is 300.
D) the price of dollar per British pound is $1.75 and the quantity of British pounds being traded is 350.
E) the price of dollar per British pound is $1.75 and the quantity of British pounds being traded is 300.
Correct Answer:
Verified
Q42: The figure given below depicts the demand
Q43: In 1991,the French mineral water Perrier was
Q44: The figure given below depicts the foreign
Q47: The supply of Thai baht in the
Q47: The figure given below depicts the demand
Q51: Suppose a hefty rise in the demand
Q57: The figure given below depicts the foreign
Q59: Under the flexible exchange rate system,when a
Q59: The figure given below depicts the foreign
Q60: The figure given below depicts the demand
Unlock this Answer For Free Now!
View this answer and more for free by performing one of the following actions

Scan the QR code to install the App and get 2 free unlocks

Unlock quizzes for free by uploading documents