The figure given below depicts the long run equilibrium in an economy.?Figure 14.1??In the figure:?AD₁ and AD₂: Aggregate demand curves?AS₁ and AS₂: Aggregate supply curves
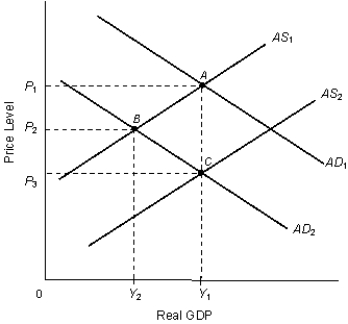
-Refer to Figure 14.1. Movement from point A to point C is equivalent to:
A) an upward movement along the long-run Phillips curve.
B) an outward shift of the short-run Phillips curve.
C) an upward movement along the short-run Phillips curve.
D) an inward shift of the long-run Phillips curve.
E) a downward movement along the long-run Phillips curve.
Correct Answer:
Verified
Q1: According to the long-run Phillips curve, which
Q2: The figure given below depicts the long
Q5: In the short run, a decline in
Q10: The figure given below shows the Phillips
Q10: In the short run, an expansionary monetary
Q11: The long-run aggregate supply curve at potential
Q11: The figure given below depicts the long
Q12: The figure given below shows the Phillips
Q14: Consider a nation experiencing the relationship illustrated
Q16: The long-run Phillips curve indicates that the
Unlock this Answer For Free Now!
View this answer and more for free by performing one of the following actions

Scan the QR code to install the App and get 2 free unlocks

Unlock quizzes for free by uploading documents