The figure given below represents the long-run equilibrium in the aggregate demand and aggregate supply model.?Figure 8.2
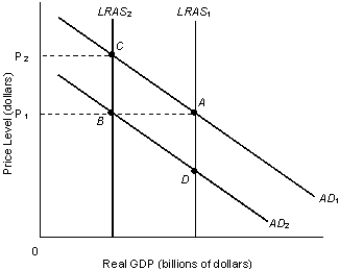
-Refer to Figure 8.2. The combination of rising prices and falling output is known as stagflation. This phenomenon is represented by which of the following shifts?
A) 
B) 
C) 
D) 
E) The combination of 
Correct Answer:
Verified
Q63: Assume that the aggregate demand increases while
Q69: Aggregate demand-aggregate supply analysis shows that in
Q75: A simultaneous increase in both unemployment and
Q76: Other things equal, an increase in aggregate
Q76: Other things equal, an increase in aggregate
Q77: The degree to which _ declines during
Q83: The figure given below represents the equilibrium
Q91: The purchase of fifty new food-processing machines
Q92: The economic reasons that underlie the shape
Q93: The figure given below represents the equilibrium
Unlock this Answer For Free Now!
View this answer and more for free by performing one of the following actions

Scan the QR code to install the App and get 2 free unlocks

Unlock quizzes for free by uploading documents