The figure given below represents the equilibrium in the market for bicycles under different demand and supply situations. The vertical axis in each panel shows the price of bikes.?Figure 3.2
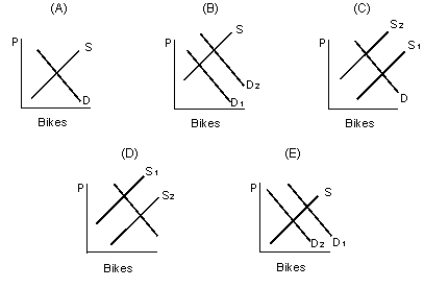
-Refer to Figure 3.2. Which of the following panels represents the equilibrium situation in the bicycle market, if there were an increase in the price of metal used in the production of bicycles?
A) Panel A
B) Panel B
C) Panel C
D) Panel D
E) Panel E
Correct Answer:
Verified
Q26: The table given below reports the quantity
Q29: The table given below reports the quantity
Q38: The table given below reports the quantity
Q41: The figure given below shows the demand
Q44: In the figure given below, D₁ and
Q47: The table given below reports the quantity
Q47: In the figure given below, D₁ and
Q52: The table given below represents the supply
Q53: The table given below represents the supply
Q60: The table given below reports the quantity
Unlock this Answer For Free Now!
View this answer and more for free by performing one of the following actions

Scan the QR code to install the App and get 2 free unlocks

Unlock quizzes for free by uploading documents