The following question are based on the following diagrams, showing the demand and supply of U.S. dollars in terms of Danish krone. For all cases D₀ and S₀ are initial demand and supply and D₁ and S₁ are new demand and supply. Assume an initial exchange rate of 9 krone to $1.
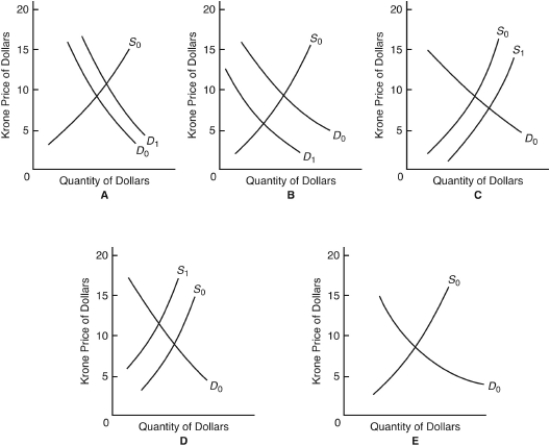
-Which diagram best reflects the effect of a decrease in U.S.tourism in Denmark?
A) A
B) B
C) C
D) D
E) E
Correct Answer:
Verified
Q25: A country's currency appreciates relative to other
Q26: The following question are based on the
Q27: In the long run,under a system of
Q28: The following question are based on the
Q29: In the face of a balance-of-payments deficit,a
Q31: Under a system of flexible exchange rates,the
Q32: Under a flexible exchange rate system,if the
Q33: If,under a system of fixed exchange rates,the
Q34: When a country's currency becomes LESS valuable
Q35: Which of the following conditions would cause
Unlock this Answer For Free Now!
View this answer and more for free by performing one of the following actions

Scan the QR code to install the App and get 2 free unlocks

Unlock quizzes for free by uploading documents