The following question are based on the following diagrams, showing the demand and supply of U.S. dollars in terms of Danish krone. For all cases D₀ and S₀ are initial demand and supply and D₁ and S₁ are new demand and supply. Assume an initial exchange rate of 9 krone to $1.
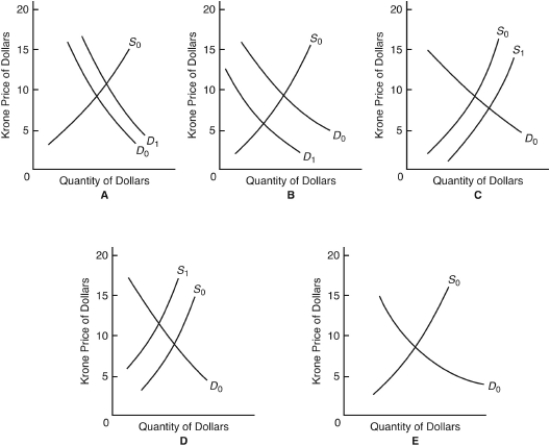
-Which diagram best illustrates the effect of an increase in the U.S.demand for Danish cheese and cookware?
A) A
B) B
C) C
D) D
E) E
Correct Answer:
Verified
Q16: Under which of the following systems will
Q17: If under freely fluctuating exchange rates,1 U.S.dollar
Q18: If,under the gold standard,the United States was
Q19: Under which of the following is trade
Q20: Suppose,in foreign exchange markets,the quantities supplied of
Q22: Under which of the following systems does
Q23: The following question are based on the
Unlock this Answer For Free Now!
View this answer and more for free by performing one of the following actions

Scan the QR code to install the App and get 2 free unlocks

Unlock quizzes for free by uploading documents