In an one-factor ANCOVA, suppose the factor has two levels (groups). Scatterplots of the dependent variable (Y) and the covariate (X) are generated (where group 1 is indicated by "•" and group 2 by "o"). Which of the following graphs shows the most desirable situation?
a.  b.
b. 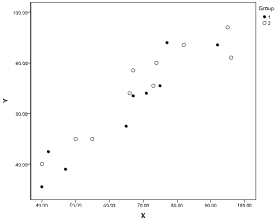 c.
c. 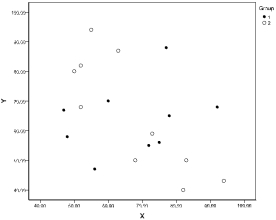 d.
d. 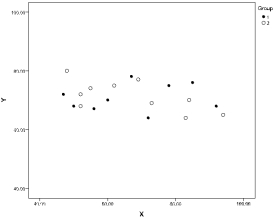
Correct Answer:
Verified
Q6: based on the following scenario:
A researcher
Q7: based on the following scenario:
A researcher
Q8: based on the following scenario:
A researcher
Q9: Matt has generated an ANCOVA. In testing
Q10: In ANCOVA, suppose Y is the
Q12: Which of the following conditions about the
Q13: An experiment was conducted to compare four
Q14: A study was conducted to compare five
Q15: In the study described in Question 14,
Q16: If the dependent variable, math score (Y),
Unlock this Answer For Free Now!
View this answer and more for free by performing one of the following actions

Scan the QR code to install the App and get 2 free unlocks

Unlock quizzes for free by uploading documents