The concentration of a compound, X, is measured at different time intervals during the course of a chemical reaction. After plotting a graph of the concentration of X against time, shown in the graph below, the points labelled A-E on the graph have the following co-ordinates: A: x = 0 seconds; y = 0 mol L-1
B: x = 8 seconds; y = 0.37 mol L-1
C: x = 15 seconds; y = 0.49 mol L-1
D: x = 23 seconds; y = 0.63 mol L-1
E: x = 30 seconds; y = 0.62 mol L-1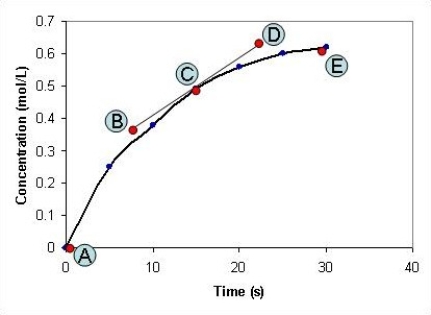 What is the rate of the chemical reaction after the reaction has been proceeding for fifteen seconds?
A) 3.26 mol L-1 s-1
B) 0.017 mol L-1 s-1
C) 0.021 mol L-1 s-1
D) 57.7 mol L-1 s-1
E) 48.39 mol L-1 s-1
Correct Answer:
Verified
Q7: In order to function at maximum efficiency,
Q8: The units used to express the rate
Q9: Which of the following statements concerning the
Q10: Which of the following statement about enzymes
Q11: Which of the following graphs depict a
Q13: Look at the graph below. At which
Q14: An enzyme-catalyzed reaction can be represented
Q15: The following graph depicts the rate of
Q16: Which one of the following statements is
Q17: The way in which the rate of
Unlock this Answer For Free Now!
View this answer and more for free by performing one of the following actions

Scan the QR code to install the App and get 2 free unlocks

Unlock quizzes for free by uploading documents