True/False
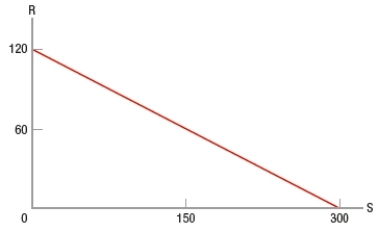
(Figure: Graph Interpretation) In the graph, a negative relationship is depicted with a slope of -0.4.
Correct Answer:
Verified
Related Questions
Unlock this Answer For Free Now!
View this answer and more for free by performing one of the following actions

Scan the QR code to install the App and get 2 free unlocks

Unlock quizzes for free by uploading documents