(Figure: Interpreting Cost and Revenue Curves) The graph shows the cost and revenue curves for a monopolist. Based on the graph, the monopolist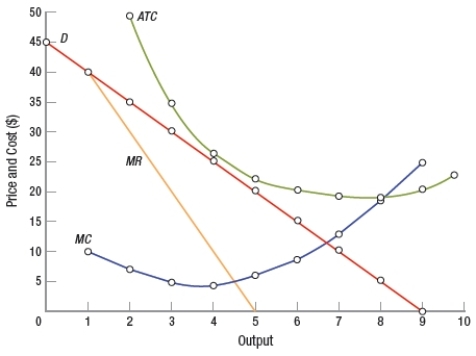
A) suffers a loss.
B) earns normal profit.
C) earns economic profit.
D) breaks even.
Correct Answer:
Verified
Q52: Which statement is TRUE?
A) Monopoly firms can
Q53: The fundamental constraint on a monopoly firm's
Q54: For a monopoly firm, if AVC <
Q55: For a monopoly firm, if AVC =
Q56: For a monopoly firm, if AVC =
Q58: For the monopolist, average profit per unit
Q59: A monopolist sells 2,000 units for $20
Q60: A monopolist sells 2,000 units for $20
Q61: As a single seller in her town,
Q62: Which statement about monopolies is NOT correct?
A)
Unlock this Answer For Free Now!
View this answer and more for free by performing one of the following actions

Scan the QR code to install the App and get 2 free unlocks

Unlock quizzes for free by uploading documents