(Figure: Lorenz Curve) In the figure, the Lorenz curve representing the deviation from perfect income equality is:
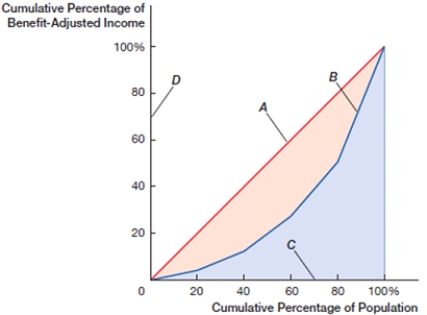
A) A.
B) B.
C) C.
D) D.
Correct Answer:
Verified
Q35: A Gini coefficient of _ means maximum
Q36: Maximum income inequality can be expressed with
Q37: The Gini coefficient representing the highest level
Q38: The Gini coefficient representing the highest level
Q39: (Figure: Lorenz Curve) In the figure, the
Q41: (Figure: Lorenz Curve 0) In the figure,
Q42: (Figure: Lorenz Curve 0) In the figure,
Q43: (Figure: Lorenz Curve 0) In the figure,
Q44: (Figure: Lorenz Curve 0) In the figure,
Q45: (Figure: Lorenz Curve 0) In the figure,
Unlock this Answer For Free Now!
View this answer and more for free by performing one of the following actions

Scan the QR code to install the App and get 2 free unlocks

Unlock quizzes for free by uploading documents