(Figure: Increase in Aggregate Demand) The figure shows a shift of aggregate demand curve to the right due to one or more of the following sources, EXCEPT:
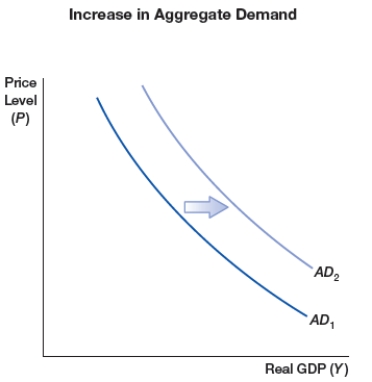
A) financial distress and uncertainty global stagnation
B) increase in money supply
C) increase in government spending
D) decrease in taxes
Correct Answer:
Verified
Q43: Which of the following is a difference
Q44: According to the net exports effect, along
Q45: Which of the following is NOT a
Q46: A shift in an aggregate demand curve
Q47: (Figure: Decrease in Aggregate Demand) The figure
Q49: The aggregate demand curve has a slope
Q50: Which of the following is NOT a
Q51: Which of the following would NOT cause
Q52: Which of the following would NOT cause
Q53: Which of the following would cause a
Unlock this Answer For Free Now!
View this answer and more for free by performing one of the following actions

Scan the QR code to install the App and get 2 free unlocks

Unlock quizzes for free by uploading documents