(Figure: Curve 0) What does the figure represent?
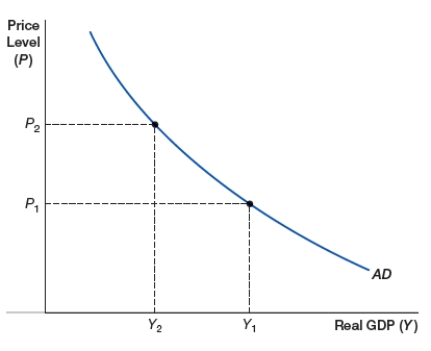
A) aggregate demand curve
B) demand curve
C) aggregate supply curve
D) supply curve
Correct Answer:
Verified
Q35: (Figure: SRAS0) In the figure, what will
Q36: (Figure: SRASA) In the figure, what will
Q37: (Figure: SRASA) In the figure, what will
Q38: (Figure: SRASA) In the figure, what will
Q39: The Martinez household has $40,000 in savings
Q41: In the context of aggregate demand, the
Q42: In the context of aggregate demand, the
Q43: Which of the following is a difference
Q44: According to the net exports effect, along
Q45: Which of the following is NOT a
Unlock this Answer For Free Now!
View this answer and more for free by performing one of the following actions

Scan the QR code to install the App and get 2 free unlocks

Unlock quizzes for free by uploading documents