(Figure: Changing Money Supply) What do graphs 'A' and 'B' represent for an economy?
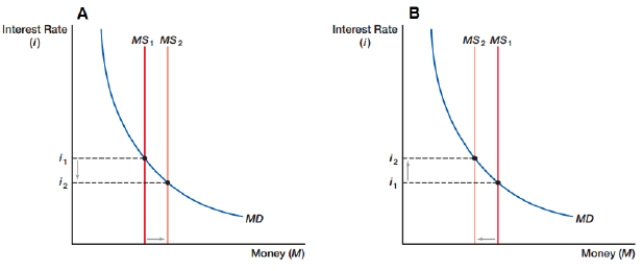
A) "A" represents an expansionary monetary policy; "B" represents a contractionary monetary policy
B) "A" represents a contractionary monetary policy; "B" represents an expansionary monetary policy
C) "A" represents an economy moving out of an inflationary boom; "B" represents an economy moving out of a recession
D) "A" represents a decrease in money demand; "B" represents an increase in money demand
Correct Answer:
Verified
Q37: An increase in the money supply will
Q38: During the early 2000s, the Federal Reserve
Q39: When the Federal Reserve reduces the money
Q40: When the Federal Reserve increases the money
Q41: If the Federal Reserve wants to cause
Q43: In the short run, after a decrease
Q44: (Figure: Changing Demand) What do graphs "A"
Q45: (Figure: Business Cycle 0) The figure shows
Q46: (Figure: Business Cycle 0) The figure shows
Q47: In the short run, after an increase
Unlock this Answer For Free Now!
View this answer and more for free by performing one of the following actions

Scan the QR code to install the App and get 2 free unlocks

Unlock quizzes for free by uploading documents