Use the figure The Net Loss to Society Due to the Overproduction of a Good. What is the area of the shaded triangle in this graph?
Figure: The Net Loss to Society Due to the Overproduction of a Good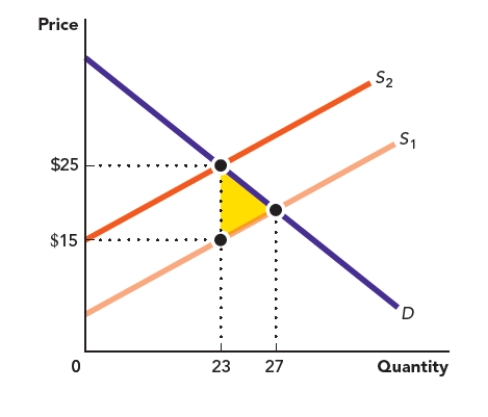
A) $575
B) $40
C) $20
D) $345
Correct Answer:
Verified
Q9: The rate at which a line rises
Q10: The price of a good is the
Q11: How is the slope of a line
Q12: Use the figure The Production Possibilities Frontier
Q13: Use the figure The Production Possibilities Frontier
Q15: Use the figure The Net Loss to
Q16: Use the figure A Firm's Profit. What
Q17: Use the figure A Firm's Profit. What
Q18: Use the figure Area of a Triangle
Q19: Use Figure: Area of a Triangle I
Unlock this Answer For Free Now!
View this answer and more for free by performing one of the following actions

Scan the QR code to install the App and get 2 free unlocks

Unlock quizzes for free by uploading documents