Refer to the table.
Table 10
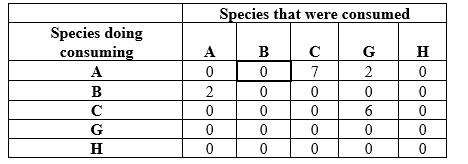 Suppose you are researching an ecological community in a new study area. You divide your study area into quadrats and sample one quadrat a day to determine the species that occupy the area and how many individuals of these species are present. Assume that by the end of your sampling efforts, you have identified all of the species that occur in the study area. You collect additional information on how biomass is transferred through your study system by determining the dietary components of each species during year 12 of your study. Table 10 shows the numbers of individuals that each other individual consumed during year 12. To read the data table, start at a species in column 1, read to the right across that row to find the number of individuals consumed, then read up to determine the species that it consumed. For example, species A consumed 0 individuals of species B (data cell outlined in bold). Refer to the data in Table 10 to understand the structure of the food web in the community in year 12.Answer the following questions:
a) Determine the composition of each species' diets and create a new table (this will be referred to as Table 11) with this data.
b) Create a food web for this system (this will be referred to as Figure 5).
c) Which species is(are) primary producer(s)?
d) Which species is(are) primary consumer(s)?
e) Which species is an omnivore?
Correct Answer:
Verified
Table 11
b)
Figure 5
Foo...
View Answer
Unlock this answer now
Get Access to more Verified Answers free of charge
Q50: Refer to the table.
Table 3: Species Abundance
Q51: Refer to the tables and the figure.
Q52: Refer to the table and figure.

Unlock this Answer For Free Now!
View this answer and more for free by performing one of the following actions

Scan the QR code to install the App and get 2 free unlocks

Unlock quizzes for free by uploading documents