Refer to the table and the figure.
Table 2
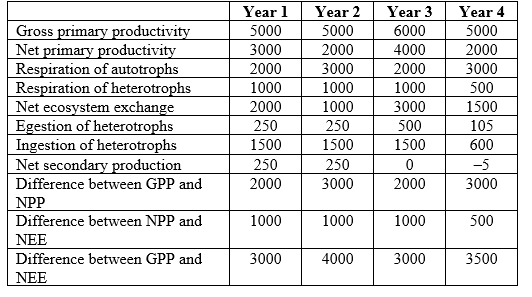 Figure 1
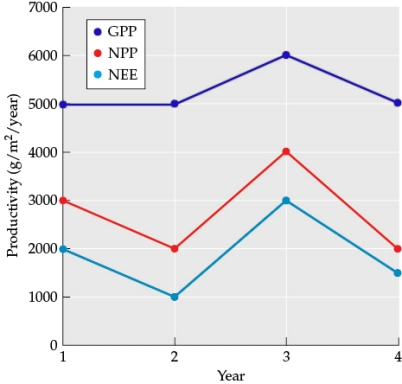
-You are studying the movement of energy through an ecosystem. You collect data on energy use at the same site across four years, measured in g/m2/year. Assume that the site is sampled at the same location on the same date each year. Assume your study area is indeed located in a tropical forest. How would you expect climate change that causes an increase in average annual temperatures to affect GPP, NPP, and NEE? How would you expect the experimental addition of fertilizer to affect the study area?
Correct Answer:
Verified
View Answer
Unlock this answer now
Get Access to more Verified Answers free of charge
Q51: Refer to the table and the figure.
Table
Q52: Refer to the table and the figure.
Table
Q53: Refer to the table and the figure.
Table
Q54: Refer to the table and the figure.
Table
Q55: Refer to the table and the figure.
Table
Q57: Imagine you are investigating the possibility that
Q58: Imagine you are investigating the possibility that
Q59: Gross primary production is higher in tropical
Q60: Net primary production is
A) the same as
Q61: If the GPP of a forest ecosystem
Unlock this Answer For Free Now!
View this answer and more for free by performing one of the following actions

Scan the QR code to install the App and get 2 free unlocks

Unlock quizzes for free by uploading documents