Refer to the table.
Table 2
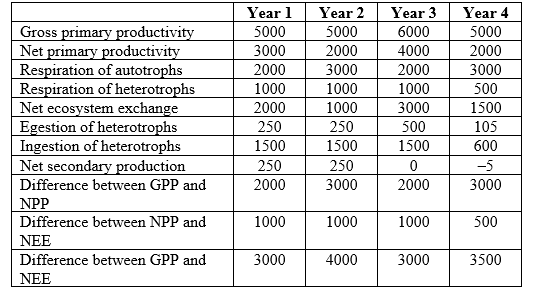 You are studying the movement of energy through an ecosystem. You collect data on energy use at the same site across four years, measured in g/m2/year. Assume that the site is sampled at the same location on the same date each year. Use the data in Table 2 to graph GPP, NPP, and NEE as a line graph (this will be referred to as Figure 1). The x-axis should be years 1-4 and the y-axis should be productivity in g/m2/year from 0-7,000.
Correct Answer:
Verified
Q44: Which statement about net secondary production is
Q45: By means of a process called _,
Q46: In the symbiotic relationships among the organisms
Q47: In hydrothermal vent communities, colonization begins with
Q48: Refer to the table.
Table 1

Q50: Refer to the table and the figure.
Table
Q51: Refer to the table and the figure.
Table
Q52: Refer to the table and the figure.
Table
Q53: Refer to the table and the figure.
Table
Q54: Refer to the table and the figure.
Table
Unlock this Answer For Free Now!
View this answer and more for free by performing one of the following actions

Scan the QR code to install the App and get 2 free unlocks

Unlock quizzes for free by uploading documents