Refer to the tables.
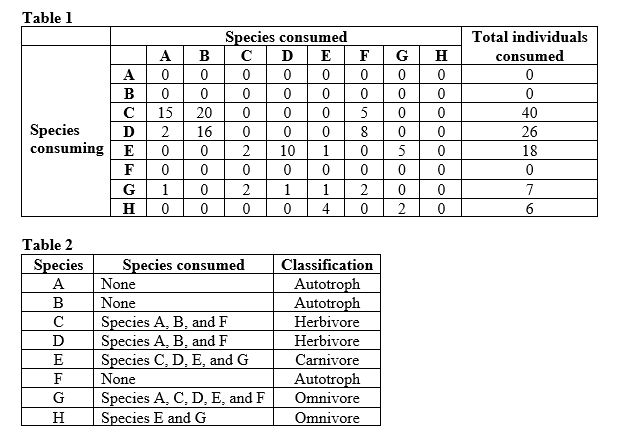 You are studying how energy flows in a food web. The data in Table 1 shows the dietary composition of species in your study area (for species A-H). To read the data table, start at a species in column 1, read to the right across that row to find the number of individuals consumed, then read straight up to determine the species that it consumed. For example, species C consumed 15 individuals of species A. What is unusual about the dietary composition of species E? Give a possible reason for this pattern.
Correct Answer:
Verified
View Answer
Unlock this answer now
Get Access to more Verified Answers free of charge
Q48: In the early 1970s, May criticized Elton
Q49: Higher trophic levels often have _ concentrations
Q50: The devastating effects of DDT and other
Q51: In which human communities would one be
Q52: Refer to the table.
Table 1

Q54: Refer to the table.
Table 1
Q55: Refer to the tables. Q56: Refer to the table and figure. Q57: Refer to the figure. Q58: Refer to the table.
![]()
Table 3
Figure 2
Table 4
Unlock this Answer For Free Now!
View this answer and more for free by performing one of the following actions

Scan the QR code to install the App and get 2 free unlocks

Unlock quizzes for free by uploading documents