Multiple Choice
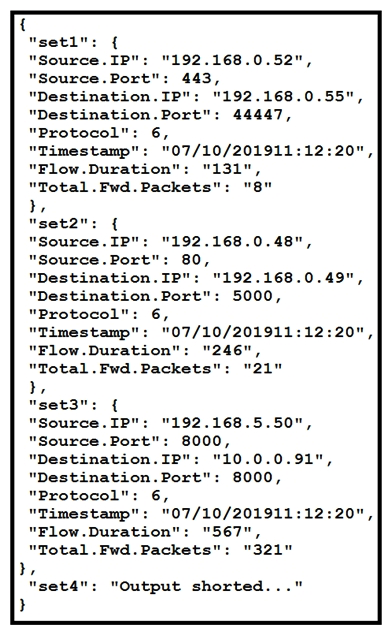 Refer to the exhibit. The code snippet provides information about the packet captures within a network. How can the most used source IP addresses within a specific time be visualized?
A) line graph
B) bar histogram
C) scatter plot
D) heatmap
Correct Answer:
Verified
Related Questions

